
Week of 10/16/2017 - Progress Report 2
- Oct 20, 2017
- 7 min read
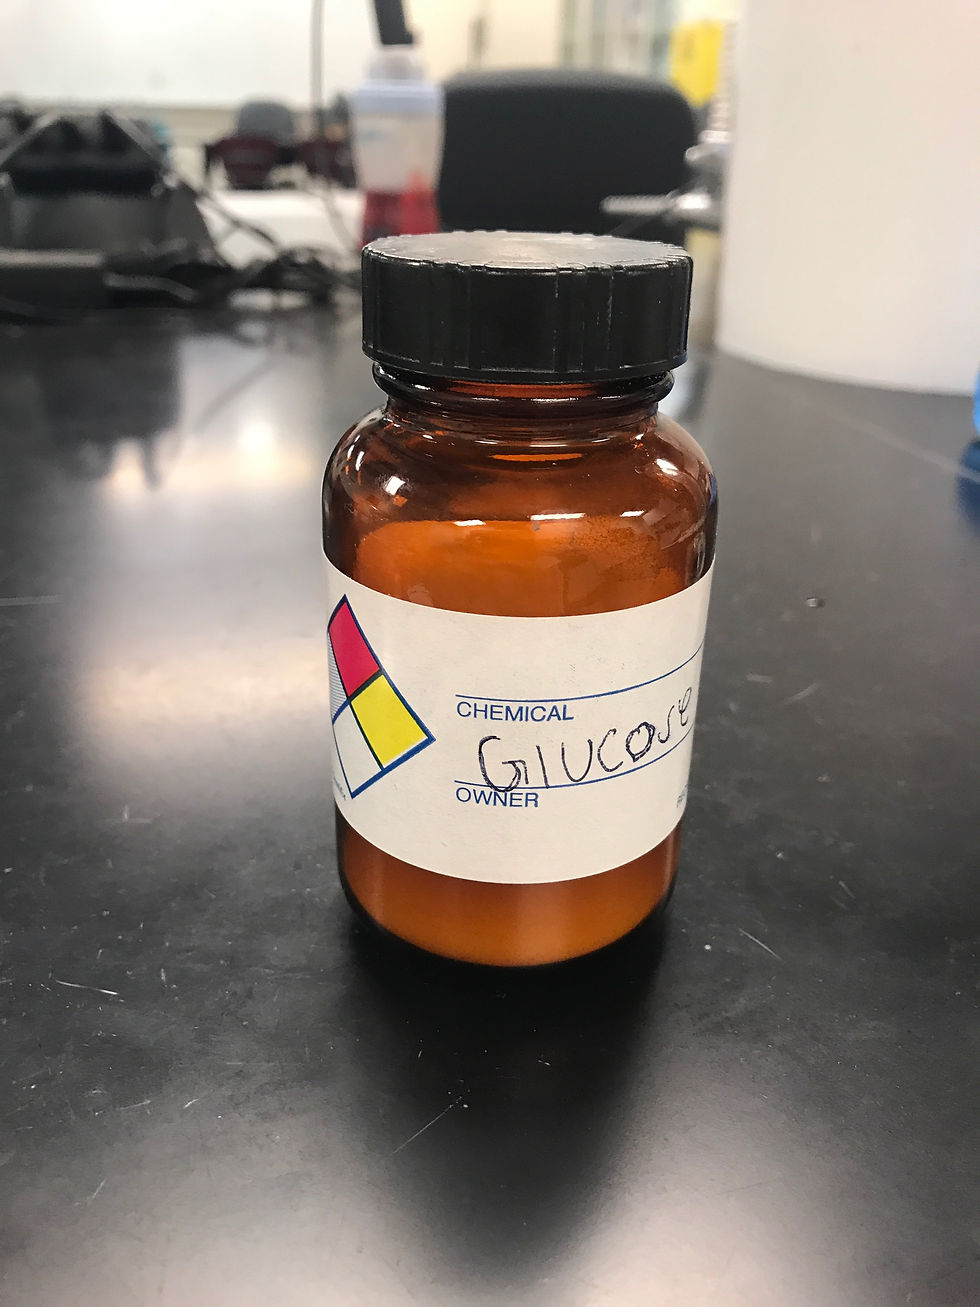
Topics covered: Verifying and confirming the theory and results of the non-invasive glucose meter project from last year and two years ago at Loyola Marymount University, displaying absorption lines of Acetylene gas on the YOKOGAWA spectrometer
Materials used: Cuvettes, pipettes, beakers, 100mL graduated cylinder, powder glucose, stirring rod, DI water, scale, optical breadboard, a NIR LED 1550 nm, a photo diode, Raspberry PI, Peak Meter Digital Multimeter
The objective for this week was to go through the research of the previous two teams who started working on this project last year and two years ago, and to recreate the results that they achieved by following all the steps that they took. The testing took place in the South Hall laboratory at Loyola Marymount University. Another objective for the week was to learn how to get absorption lines of Acetylene gas on the spectrometer in the lab.
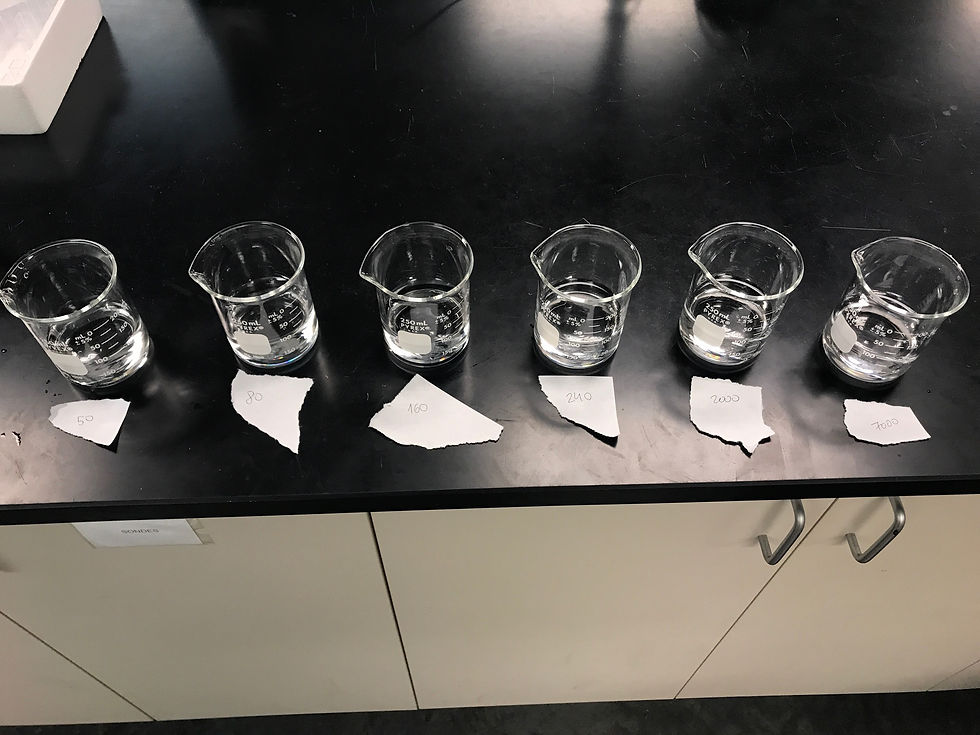
First, the solutions needed to be made. Prior to using any equipment, all of it was cleaned by DI water, which is on tap in the lab. According to the results from previous years, 6 samples of DI water with different glucose concentrations were made. The concentrations of glucose used in the DI water solutions were:
50 mg/dL
80 mg/dL
160 mg/dL
240 mg/dL
2000 mg/dL
7000 mg/dL
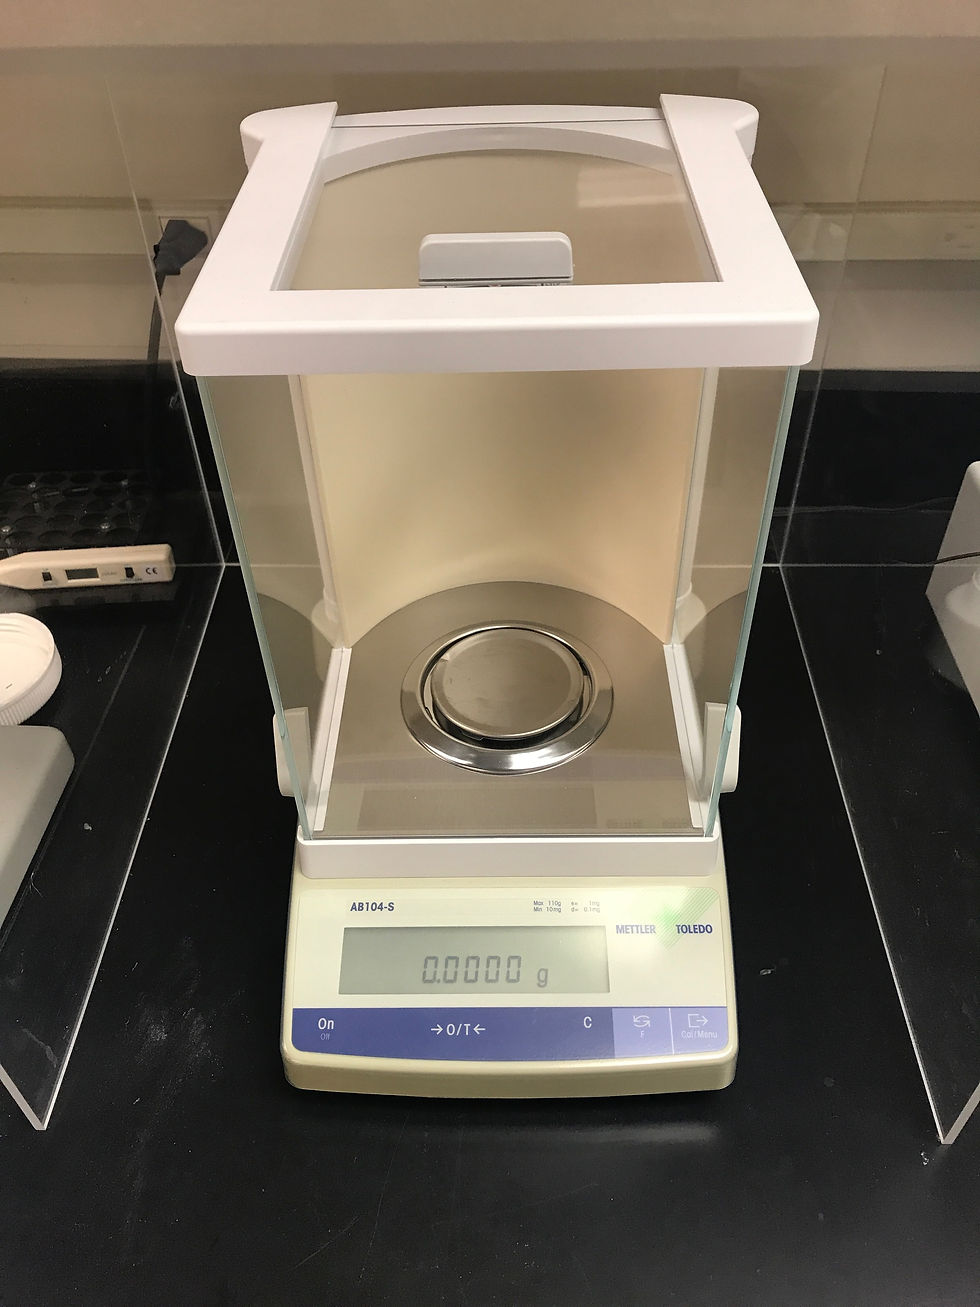
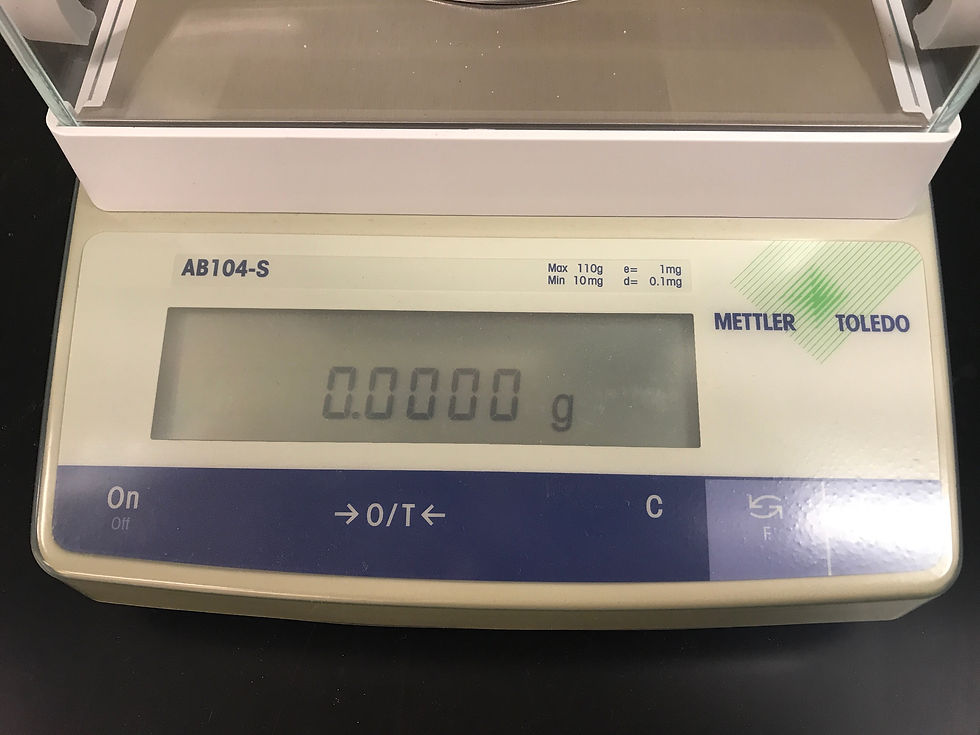
This means that 50, 80, 160, 240, 2000 and 7000 mg of glucose were each dissolved in 6 separate beakers with 1 dL, or 100 mL of DI water. By using the high precision scale with .0001 accuracy readings, we were able to get the most accurate measurements of glucose possible. The scale used and the close up of its accuracy are shown in the figure below.
The recorded glucose measurements are as follows:
50 mg/dL – 54.2 mg
80 mg/dL – 81.2 mg
160 mg/dL – 164.6 mg
240 mg/dL – 243.1 mg
2000 mg/dL – 2058.9 mg
7000 mg/dL – 7301.3 mg
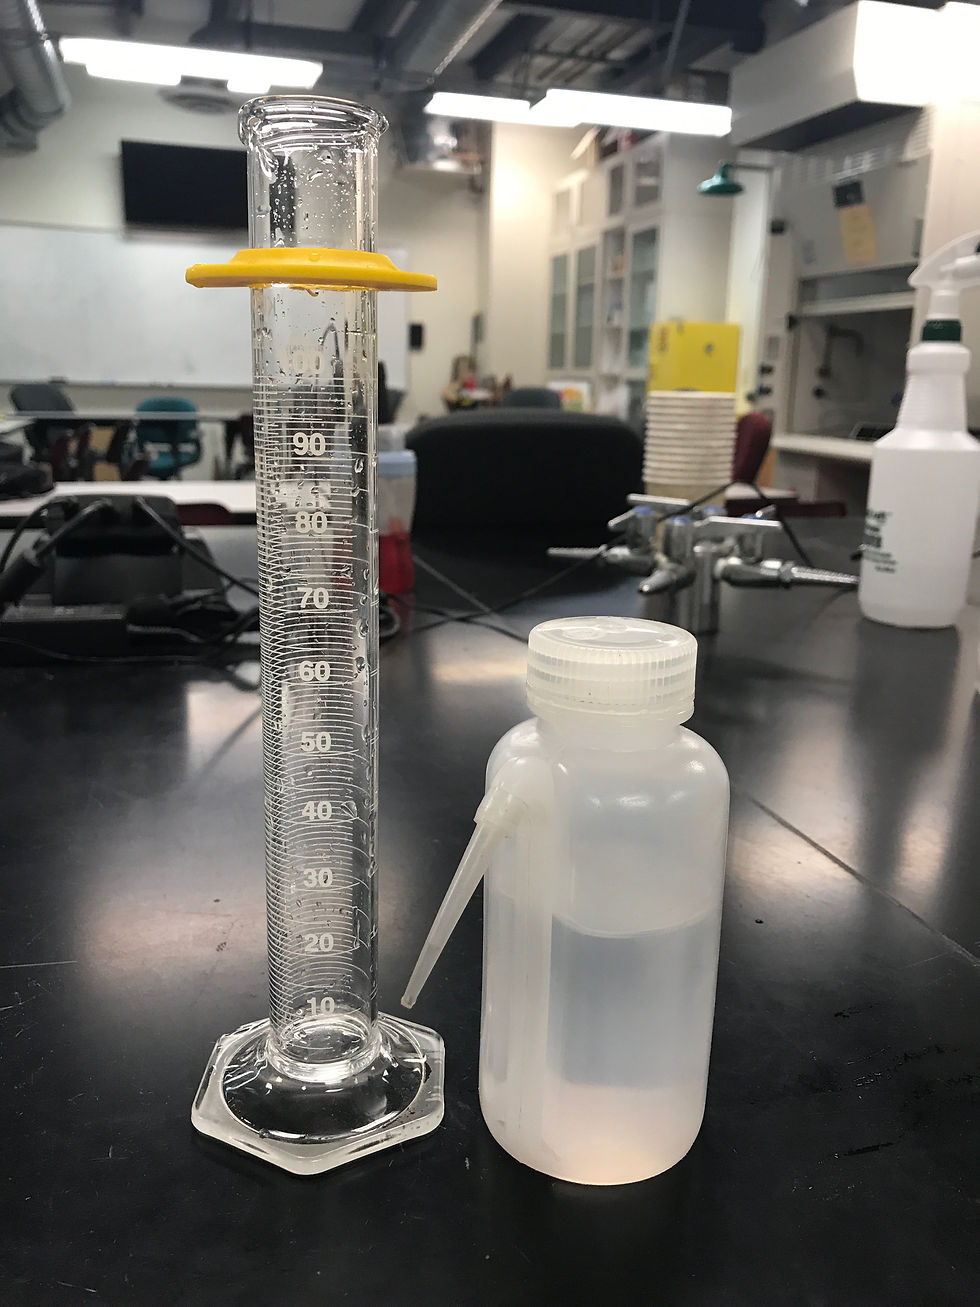
These various weights of powder glucose were each dissolved in 6 separate beakers. A stirring rod was used to stir the glucose in the DI water. A 100mL graduated cylinder, as shown in the picture below, and a DI water squirt bottle were used to accurately measure the exact amount of DI water that needed to be put in every beaker. As stated previously, that was 100 mL of DI water per beaker/concentration of glucose.
Next, the circuit was assembled. The optical breadboard with all the components in it was saved from previous years, so most of the set up was already there. There was an already built 3D printed cuvette stand on it as well. A drawn diagram of the circuit is shown below.
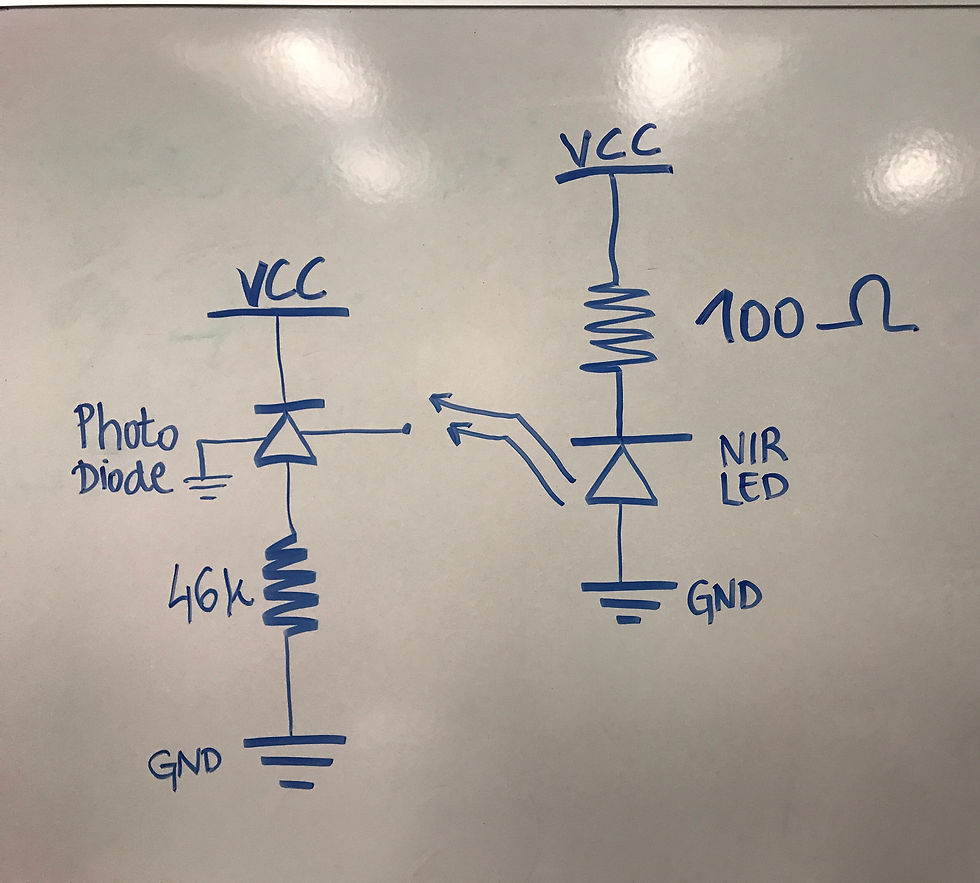
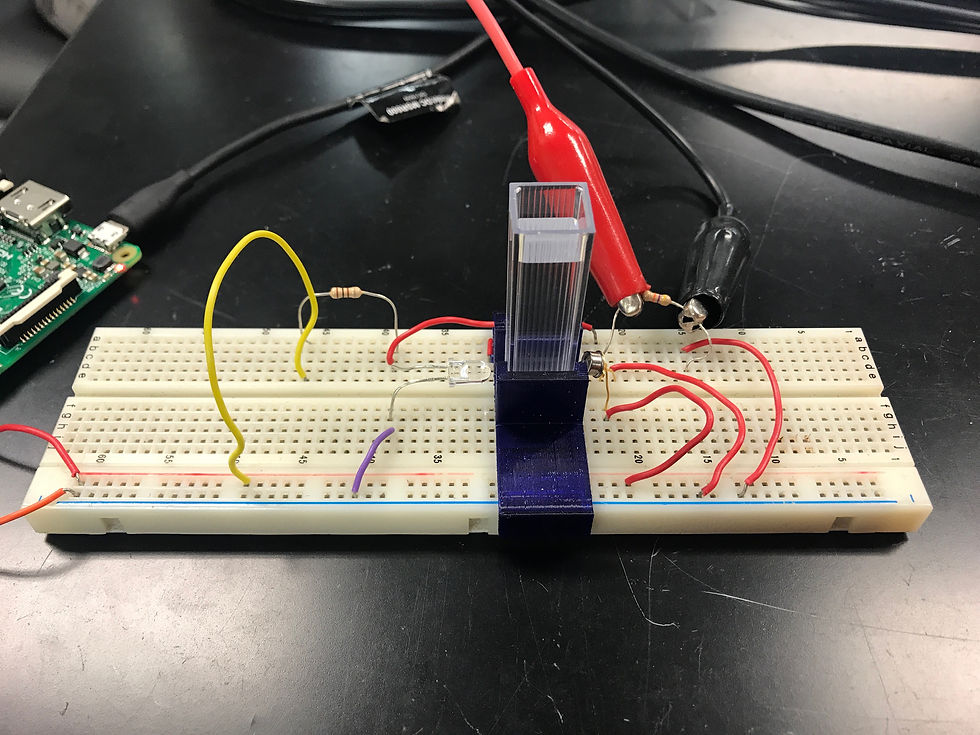
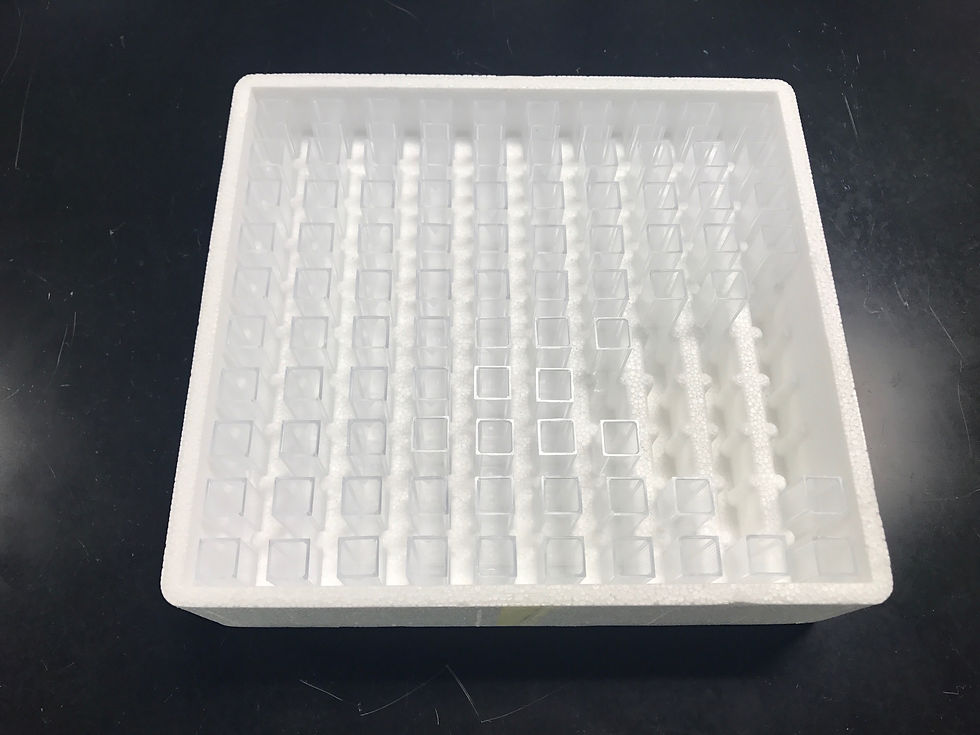
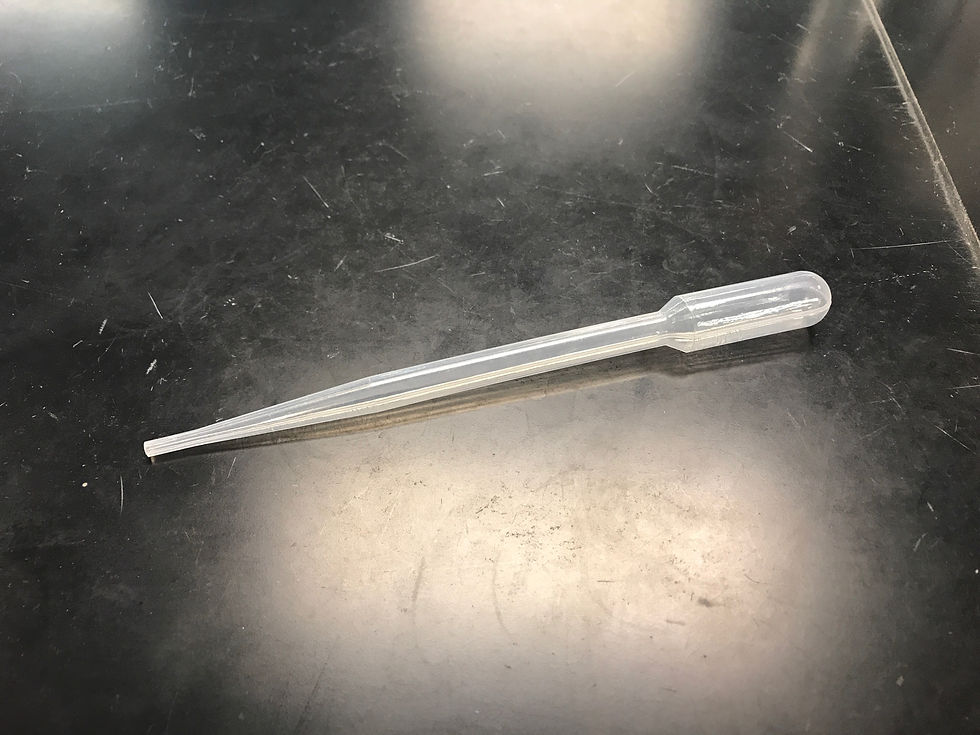
Then, solutions with different glucose concentrations were put in the cuvettes using a pipette. Thanks to the help of the chemistry department and their stock room, we were able to get 88 cuvettes for this project, and multiple disposable and easy-to-use pipettes. By following the optical set up outlined in one of the old reports, a circuit was finalized. The resistors used in the circuit were 47 kOhms and 100 Ohms. The picture of the optical set up on a breadboard with a cuvette with a solution in it is shown in the picture below.
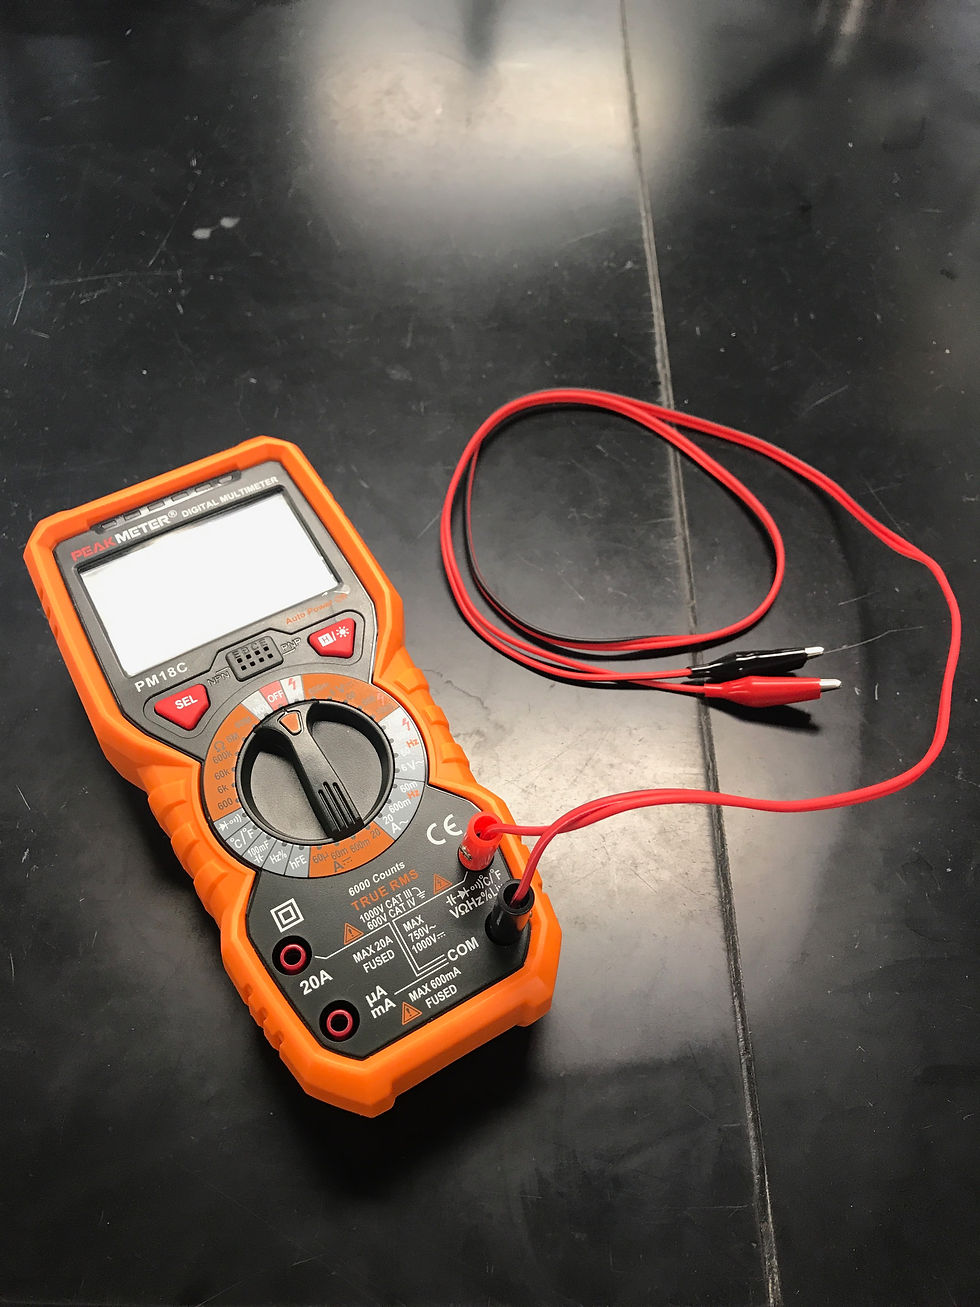
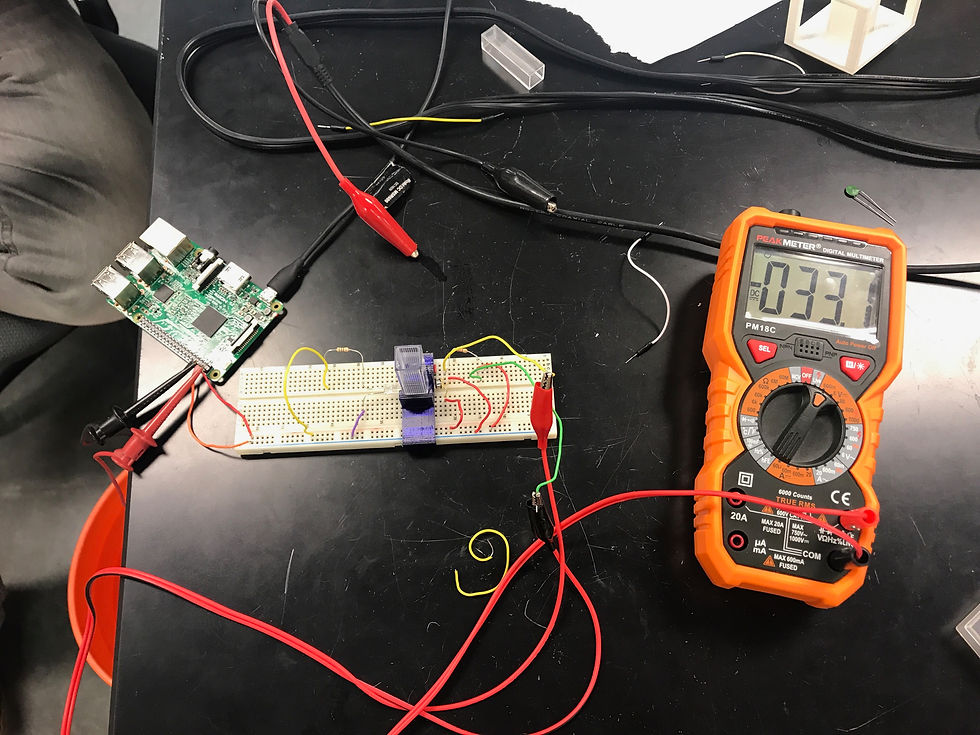
After the circuit was completed, a Raspberry PI was connected to it for power. Theoretically, 5 Volts of voltage was supposed to be applied, but the measured voltage applied came out to 5.17 Volts. According to research, the groups in the past did this project by measuring voltage across the resistor connected to the photo diode, and recording the voltage in five trials. The average of 5 trials was taken and plotted vs. the concentrations of glucose. If the graph and measurements showed that as the concentration of glucose increased, that the voltage measurements would decrease, that would confirm that creating a non-invasive glucose meter is possible in real life. A Peak Meter Digital Multimeter was used to measure voltage across the resistor connected to the photo diode. You will see below the picture of the Digital Multimeter used and also the circuit set up with the Raspberry Pi connected, as well as the Digital Multimeter.
The graph of the measurements taken last year is shown below first. Next, a spreadsheet of voltage values which I took two days ago are recorded during five trials for each concentration, as well as the graph that represents the relationship between the concentration of glucose and voltage. As you can see from these graphs, the experiment was successfully recreated and this is confirmation that all the previous research was accurate and verified.
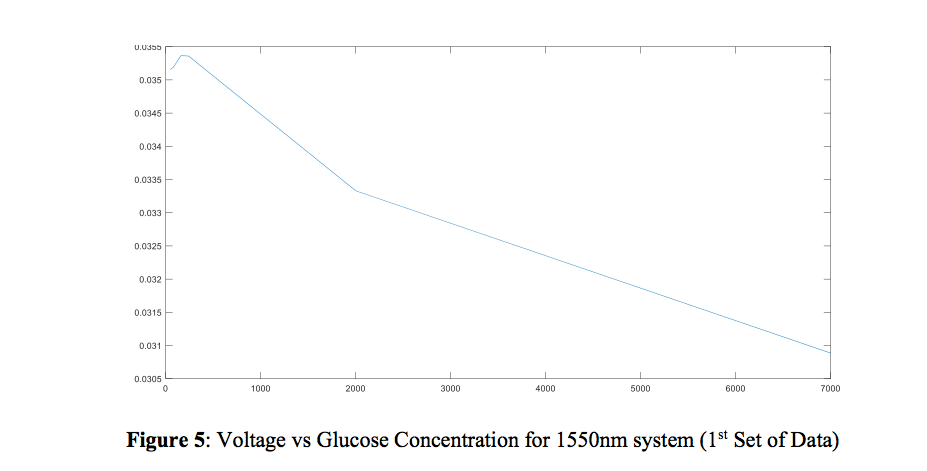
This graph depicts results from last year and 2 years ago.


This graph shows my results, taken 2 days ago.
During testing, multiple things were observed. Though not mentioned in any reports previously found, the distance between the diode and the NIR LED is very important. The cuvette is placed in between these two components. While trying to take measurements of the voltages, I noticed that the voltage readings were unstable and constantly changing. I thought this was normal for an optical set up, but then I realized that a Near Infrared LED was being used in the circuit and that external effects, such as light and movement are probably affecting the measurements. So, I used my hands to shield the circuit, and this gave stable voltage readings on the digital multimeter. However, just to be safe and make sure that the error percentage is small, five trials were recorded for each cuvette, or each concentration of glucose.
Another thing I noticed is that if you even slightly move the NIR closer to the cuvette, the voltage reading increases. If you move it further from the cuvette, the voltage reading decreases. This led me to believe that it is really easy to mess up on this type of project. The components used to verify such a complicated theory are easy to move and it is easy to get wrong readings and measurements. That is why this year, we are so lucky to be having the equipment that we do. The test circuit should be stable and not moving ever or for any reason after it is initially set up. This way, we know that the accuracy will be at its highest percentage, since there will be no moving it around. The readings will be at the same calibration for whatever we want to measure. The components that we will be using, such as the collimator which will be mounted on a sturdy post holder in a metal post, will all be securely screwed in a metal board, which will provide stability for this year long project.
One more thing I was confused about is why such a big jump was made with glucose concentrations. They went from testing 50, 80, 160 and 240 milligrams of glucose to 2 and 7 grams. This seems like a big jump and it didn’t make sense to me. Also, this amount of sugar in blood is unrealistic. However, I realized that the readings at small concentrations of glucose are really small and close to each other. The big concentrations of glucose were tested to prove the theory that voltage drops when the concentration increases, and it was successful.
After discussing all of these instances with our project advisor, Dr. Hossein Asghari, I came to realize that though not mentioned, the distance between the components for the old optical set up is really important, and it is crucial that is recreated to the maximum accuracy possible, so that the measurements are valid and accurate. Regarding the external influences on the NIR LED, I was told that this project was previously done in the Faraday cage, which we have in our Electronics lab on campus. This allowed for maximum accuracy when it came to measurements, as the Faraday cage is a space which blocks electromagnetic fields. This means that all external inputs were blocked and it was a controlled environment that could give accurate measurements. Also, when being tested, previous students were super careful when dealing with the optical set up. It was attached to a small, heavy metal board which was heavy and not easy to move. This could somewhat guarantee that the set up wasn’t being interfered with. Also, a dark box was used to cover the circuit, in order to prevent external influences to the measurements from the circuit.
Unfortunately, I couldn’t arrange a time with our lab manager to get in the Faraday cage this week and re-do the measurements in this controlled environment to ensure accuracy. Also, Dr. Asghari suggested that I confirm and verify the work done 2 years ago as well. Their graph is a little different than what I got doing my measurements which I was trying to replicate from last year. However, this was a big breakthrough for this project two years ago so I want to make sure it is fully functional.
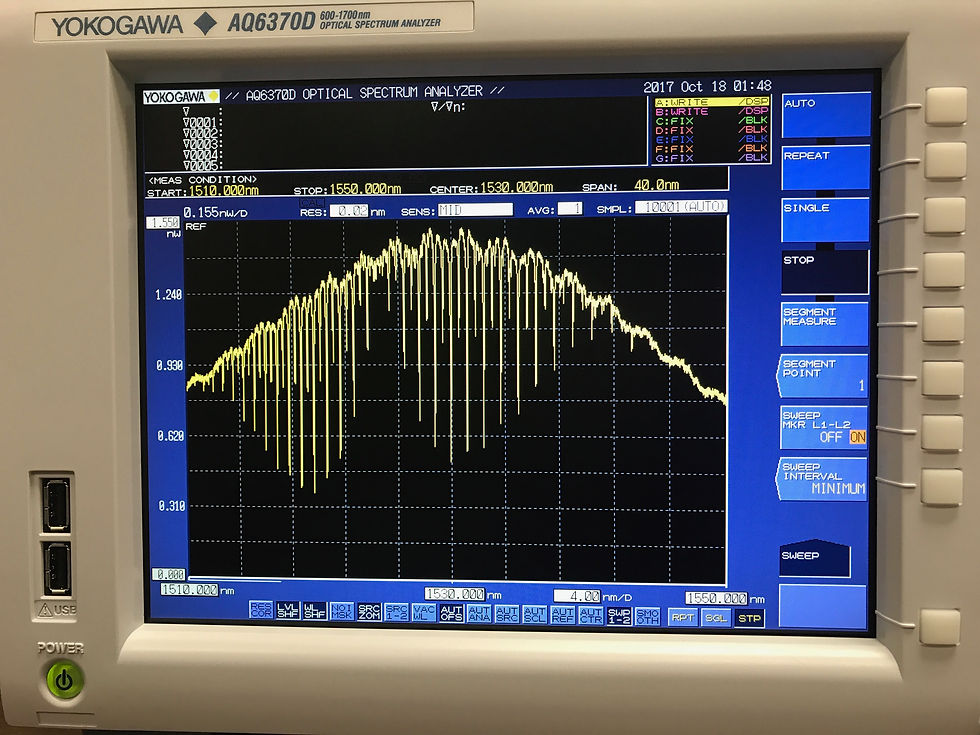
Another objective for this week was to show absorption lines on the YOKOGAWA spectrometer of Acetylene gas. After learning how to deal with various start and end wavelengths, peak displays and resolutions, this was a useful learning experience, as in our project, instead of using an unreliable optical set up that was very sensitive which makes it prone to error, we will be looking at absorption lines of glucose to prove that it is possible to build a non-invasive glucose meter. This will allow us to see more precisely the results and also, be sure that external influences weren’t a factor when taking measurements. Below are the pictures of absorption lines of Acetylene gas.
For next week’s update, all previous year’s works should be checked and verified in the Faraday cage, using the box to cover the circuit, as well as extra caution and patience for taking results, making sure none of it is moved at any point during the testing. Results should and will be plotted and compared to the old research.


Comments